Gas goes global

Unlike the highly liquid global oil market, natural gas has always been traded regionally. Asia, Europe and North America represent three different gas markets with their own unique dynamics.

Regional gas markets

Asia is very reliant on LNG (liquefied natural gas) imports. Natural gas demand significantly outstrips low levels of domestic production. Prices spiked after the Fukushima Daiichi disaster in 2011 when Japan began importing record volumes of gas for electricity generation to replace the output of nuclear power plants that were shut down.

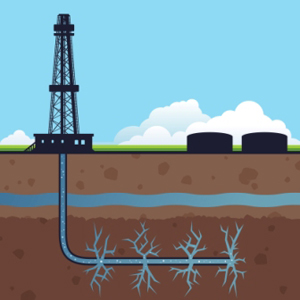
North American gas production has always been strong, but exploded over the past few years. Hydraulic fracturing (or fracking) activity and the discovery of significant shale gas reserves halved North American gas prices between 2010-11. Prices remain at historic lows today. Henry Hub in Louisiana, where North American gas is physically delivered as well as virtually traded, is the world’s most liquid spot and futures market for natural gas. North America’s well-developed pipeline infrastructure also minimises transportation costs and promotes access to the market. And a high degree of competition lowers the barriers to entry.

Europe’s numerous trading hubs are still developing and are yet to match Henry Hub’s liquidity. Until recently the majority of European wholesale gas buyers maintained long-term contracts with mega-suppliers – namely Russia’s Gazprom and Norway’s Statoil. According to the Oxford Energy Institute, 2015 was the first year that more than fifty-percent of gas trades in Europe took place on the spot market. Demand has yet to return to pre-2008 levels and is still soft across the continent, but prices remain consistently higher than in the US.

Gas producers rely on pipeline infrastructure to connect supply with demand centres. This is why North America’s shale gas revolution and the subsequent decline in natural gas prices have not affected European prices – no pipeline crosses the Atlantic. But, LNG can easily be shipped between the continents. Why then are the world’s two biggest gas markets still disconnected?

Intercontinental LNG trade

LNG (liquefied natural gas) is made by cooling natural gas to -162ºC. This transformation to liquid shrinks the volume of the gas 600 times, making it safe and easy to ship. LNG is colourless, odourless and non-toxic. Nevertheless, the added cost of liquefaction, sea transportation in specialised vessels and regasification at the destination has so far limited global arbitrage opportunities.

Yet, a barrage of new LNG investment over the past few years has lead some to speculate that natural gas markets are globalising. The International Energy Agency claims that global liquefaction capacity will increase by forty-five percent between 2015 and 2021, with most of this growth coming from the United States and Australia. If this glut makes enough cheap LNG available then North American and European gas prices might slowly converge.

In February, the Cheniere Energy LNG terminal at Sabine Pass between Texas and Louisiana was the first to begin exporting. In anticipation of a LNG supply glut Eastern European countries, including Poland and Lithuania, have been building regasification terminals. Lithuania is testing floating regasification technology – offshore plants connected by pipeline to the shore. Spain, being part of a peninsula, is isolated from the European continent’s pipeline network. Historically, this has made it an important destination for LNG cargoes. In fact, the economic downturn since 2008 created an opportunity for Spanish buyers to reload LNG cargoes and sell them in Asia where prices are higher. This churn enhances liquidity. Otherwise, LNG is injected into the network all over Europe. There are important regasification terminals in the Mediterranean: Italy, Greece and France, as well as north-western Europe: the UK, the Netherlands and on France’s west coast.

US LNG producers are increasingly flexible too – offering variable volume contracts or FOB (free-on-board) cargoes. Variable volume contracts permit buyers to increase or decrease the amount of gas they take depending on their needs. They may purchase extra volumes to take advantage of high spot prices – reselling the LNG cargo or trading gas locally. Or they may reduce their volume off-take when local demand is low. FOB means a buyer has not yet been found nor locked into delivery. An LNG cargo leaves the liquefaction terminal and can be bought and resold “on board”. The cargo may eventually be dumped in a spot market at a loss if a buyer can’t be found, but LNG suppliers’ willingness to send out FOB cargoes shows liquidity to be improving.

Not yet a single market

European countries are keen to reduce their dependence on Russian gas for political reasons. However, uncertainty remains as to whether US LNG can compete with Gazprom on price.  Analysts at the Oxford Energy Institute estimate Gazprom’s cost of delivering gas to Germany to be 3.5 USD per mmbtu (million British thermal unit). Whereas the break-even price for the cheapest US LNG supplies is around 4.3 USD per mmbtu – even with Henry Hub still trading at historic lows. Gazprom, Europe’s largest gas supplier, has significant spare production capacity and some of the lowest cost production in the world. Given these conditions, LNG traders are unlikely to win a price war on the continent.

In sum, greater supply and liquidity in the global LNG market offers some opportunities for arbitrage between the continents and provides European gas buyers with options. This does have the potential to disrupt Europe’s monopolies and introduce greater competition into the market.  Yet, LNG and pipeline gas markets are not one and the same. Whilst the price gap persists, gas markets will retain their regional characteristics.


Coal condemned

During the last decade, the majority of the OECD countries decoupled their economic growth from energy consumption. Normally these rise in tandem – a trend that persists in developing countries and world’s soon-to-be fastest growing and most populous nation, India.

This decoupling happened as developed nations shifted to providing services and building knowledge economies, which is less energy-intensive than industrial production and manufacturing. China too has started down this path. Policy-makers now talk of “decarbonising” the economy. That is, only producing and consuming energy which does not release greenhouse gases into the atmosphere and contributing to climate change.

Decarbonisation is currently focussed in the electricity sector where it is being helped along by policy incentives. Subsidies, guaranteed prices for electricity and tax-breaks dramatically boosted the growth in renewable electricity generation across Europe in the last few years. The liberalisation of Europe’s electricity markets and new regulation improving competition also played a role. Although, falling prices and technology gains spurred the sector’s expansion more than any government policy, particularly for solar power.

For renewables’ expansion to make any difference to greenhouse gas emissions coal-fired power production has to be tackled. Although it is cheap, burning coal releases significantly more greenhouses gases than other fossil fuels including gas in the electricity sector and oil in transportation. Europe’s aging fleet of coal-fired plants are also extremely inefficient at generating electricity compared to newer gas-fired units. A quarter of electricity in the European Union and almost forty-percent in the United States is still generated by burning coal. It is around two-thirds of the electricity mix in China where the resulting air pollution in its major cities is fuelling a sense of urgency.

Political leaders are aware of this danger and are acting to reduce coal production and consumption in many countries around the world. By 2025 all coal-fired power in the United Kingdom will be shut down according to current plans. New Zealand will close its two remaining large-scale coal-fired power plants in 2018. The provincial government of Alberta in Canada, where the tar sands industry alone produces more emissions than Portugal, has announced plans to phase-out coal power over the next fifteen years. China’s goal is to cap coal consumption in 2025 and accelerate its decline thereafter.

President Obama’s Clean Power Plan intends to restrict emissions from current coal-fired power plans, substitute coal with gas-fired or zero-carbon generation and impose strict emissions standards on new plants. The goal is to cut emissions in the electricity sector by a third relative to 2005 levels. Coal mining states have fiercely contested this “war on coal”, which is bound to be difficult for certain towns and regions whose local economy and workforce are dependent on coal mining, not just in the US. Nevertheless, coal needs to eventually exit the electricity sector if the commitments made by the US and 195 other countries at COP21 in Paris late last year are to materialise.

Yet, none of the above is enough to slow climate change. India is set to contribute the greatest share of growth in global coal demand in the future, mostly from increased domestic production. How it intends to reach its goal to produce forty-percent of its electricity from non-fossil fuel sources by 2020 is unclear. In Germany, coal’s resurgence in the power sector has cast a shadow over its achievements in increased generation from renewable resources. Angela Merkel’s government is working on a plan to phase out coal by mid-century. From the European Unions’s biggest economy this is too long to wait. Decarbonising electricity production by phasing out coal remains a long way off. Coal has been condemned by the world’s leaders but not yet replaced.

Climate vs. Weather

Climate change is underway. The mainstream now accepts that human behaviour and industrialisation contributed to increasing the amount of greenhouse gases present in the atmosphere over the last century. Yet, it remains difficult to link specific weather events to climate change.

Climate is not the same as the weather. Weather is a local phenomenon. Also, it is very predictable despite what you might think about your local weather channel. Forecast accuracy increases significantly one week out, one day out, one hour out, as we approach hour zero. Even ten-year olds learn that when winds gather in the harbour and clouds are swept inland, rain will begin to fall as the clouds cool rising above sea level.

Climate is the aggregate of weather patterns on a regional or global scale, averaged out over years, decades or even centuries. Climate systems are “chaotic”. In scientific terms this means highly complex with numerous interdependencies, so it’s very difficult to make predictions.

Scientific models are getting better all the time, but the climate’s “chaotic” nature means even tiny deviations in initial data and assumptions, can lead to wildly divergent results. John Nash’s poetic metaphor, referred to as the butterfly effect, translates this concept into everyday language: when a butterfly flaps its wings, a hurricane is born on the opposite side of the globe. Climate scientists have millions of butterflies to consider.

Furthermore, changes in the aggregate tell us little about the local effects of climate change. Weather scientists can tell us what the weather will be like in London, Dubai or Delhi tomorrow. But climate scientists do not have the same job. They cannot paint a very accurate of picture of what daily weather will be like in Delhi in ten or twenty years time. Will Californian residents suffer fewer droughts if America bans emissions-intensive coal power production? What colour is the butterfly’s wings?

This is where statistics can play an important role. Statistic climate models measure how likely it is that something will happen. Lord Stern’s landmark 2006 report for the British government (research that was updated in a 2014 report with the Global Commission and the Economy and Climate) evaluates the risks and probabilities associated with climate change – from both a business and government policy perspective – despite scientific uncertainty.

We know that extreme weather events have become increasingly probable. We will witness both more frequent and more intense storms, heat waves, polar vortices, droughts and fires. Landscapes are changing as coastline disappears. Higher average temperatures affect ecosystems. The indirect costs of climate change include crop failure, mass migration, loss of biodiversity and a spread in airborne maladies. Dangerous air pollution in many cities worldwide, caused by burning fossil fuels, furnishes us with yet another reason to quit pumping the gases they produce into the atmosphere.

We also know that certain regions face greater risks than others. As fate would have it the regions most susceptible to climate change’s impacts are those least equipped to deal with them. Such as the Pacific islands and South-East Asia.

Why is that? A priori,  proximity to the ocean and the equator entails more extreme weather, which climate change will exacerbate. Yet, these regions are also less developed. They are incredibly dependent on the weather to ensure reliable food production. Insurance policies are rare. Millions of people live in very simple shelters, easily destroyed in high winds or fires. Their communities often lack modern luxuries such as electricity, televisions, insulation, climate control or running water. This means they are more likely to die during or following an extreme weather event – because they do not receive the evacuation message, cannot adequately shelter themselves or escape the heat or cold, and may starve or be forced to drink contaminated water whilst awaiting disaster relief.

Hurricanes are common in the South Pacific region between November and April. However, earlier this year, Vanuatu was battered by extrordinarily violent winds and rain for which there was little precedent. The initial deaths following Cyclone Pam were tragic. However, starvation and water contamination followed and pushed the death toll up. Economic reconstruction of the region, which is primarily dependent on subsistence farming, will take years.

Another recent example: thousands perished in a dangerous heat wave throughout Pakistan and India’s north where temperatures reached 47 degrees Celsius in May of this year. We cannot overestimate the danger of excessive heat for infants and the elderly. People’s bodies become very stressed under such conditions. This combined with dehydration or sleep deprivation leads to fatalities.

Sceptics are right to doubt that Cyclone Pam or the recent heat wave were directly caused by climate change. Drawing a direct vector between burning fossil fuels and extreme weather events is near impossible as explained above.

Nevertheless, these regions have not benefitted from industrialisation, and the tremendous boost to economic well-being it engendered, to the extent that we have across the developed world. Yet, they will be the first to suffer from industrialisation’s perilous side effects.[1]

This is why Cyclone Pam and the Pakistani/Indian heatwave are relevant. These examples help us to identify what is really important about climate change. Climate change is a question of social justice, not the weather.


[1] Not that pockets of wealth do not exist in these regions or people in more developed parts of the world have never known disaster – as witnessed in 2005, in the United States  following Hurricane Katrina.

Future electricity grids: the rise of the prosumer

Unlike other commodities such as gas and oil, electricity cannot  be easily stored. It must be consumed almost as soon as it is produced.

Consumer demand follows a fairly predictable pattern. Electricity prices are higher on weekdays when “peaking” power plants come online to satisfy increased demand. The first demand peak occurs in the morning – when a high proportion of the population is getting ready for work or school.  A second peak occurs in the evening when consumers return home and start cooking dinner, or turn on the television.

Conventional power generators such as coal and gas turbines can respond quickly to variable consumer demand by increasing fuel input and ramping up output during the day. Nighttime is a cool-off period.

Intermittent renewables changed this model. We must now factor in unpredictable supply peaks and increased price volatility. In the UK and Germany consumers bear the brunt of these new costs. You can read more about how renewables are shaking up the traditional power model here. 

There are several ways to manage this new supply intermittency and smooth prices.

One is more interconnections. These reduce bottlenecks and diversify supply sources so that electricity-rich areas can service electricity-poor ones. Nations hoping to boost electricity production from renewable sources will need a well-connected grid, as an oversupplied area can experience shortages as soon as the weather changes. New power lines require public support and investment.

Short-term (spot) electricity trading can optimise electricity flows between areas and facilitate price arbitrage. Spot trading services are offered by EPEX Spot in Central Western Europe or ERCOT in Texas, for example. These services also permit renewable energy producers to rebalance their books if the weather forecast was inaccurate and they produce much more or much less electricity than predicted.

Smart grid technology uses real-time information about supply and demand to automatically adjust electricity flows curtailing price peaks (or negative prices). Again public money is needed to roll-out this infrastructure at the national level.

Another means is electricity storage.

Pumped hydro-storage has existed for a long time. It is the only large-scale storage technology used commercially. It involves pumping water uphill when electricity prices are low, then running water downhill, through turbines, during peak-price hours to generate electricity. Pumped hydro projects are nevertheless hugely dependent on local geography and rainfall, as well as regulations regarding water-use.

The lithium-ion batteries used in electric cars pack a lot of energy density for their size. They cost around US$10 000, even for a small vehicle, and can only run for about 175km before recharging. This could be better. Crucially, lithium-ion batteries do not suffer from “memory” issues. Meaning that don’t need to be drained before being recharged.

Battery manufacturers across Asia and the USA are struggling to cut costs and upscale their technology to plug into the electricity grid. Yet, electricity generation is decentralising. Small-scale industrial and household solar production is on the rise. Rather than selling their excess power back to the grid some could go off-grid.

Most experimental batteries would need to be bigger than a house in order to store enough solar electricity to power one household for a day. And they remain prohibitively expensive. However, Tesla caused a lot of excitement last month when it announced plans to market lithium-ion batteries at prices starting from US$3500. It costs a household a further US$5000 or so to install solar panels. Nevertheless, this much-anticipated battery is priced lower than any other technology on the market. The Tesla battery should be small enough and safe enough to install in your basement. Plus, you don’t need to be a rocket scientist to operate it.

How did they do it? It’s not new technology. Rather, Tesla is building a US$5 billion gigafactory in Nevada’s desert, where it hopes to realise enormous economies of scale. While the market is still waiting for a technological revolution – the step-change that would make batteries as portable and powerful as microchips which are continuously delivering ever cheaper computing power – Tesla intends to reduce manufacturing costs for current battery technologies.

There is a sizable market of homeowners prepared to fit out their homes with solar panels, battery storage and adopt other energy efficient technologies. These early adopters need enough cash to  invest upfront, before they reap the benefits in reduced or zero-cost electricity bills in the months and years that follow.

For most middle class homeowners US$8500 is no small fee. Companies such as SolarCity in the US provide another piece of the jigsaw. Financed by high net worth individuals, as well as Google and Goldman Sachs, the company pays for solar panel installations, aggregates the earnings from energy savings and grid buybacks, then sells bonds based on a predicted revenue stream. Such creative financing will hasten the prosumer revolution and eventually take some of us off-grid.

No one technology will solve all the problems intermittent renewable energies have introduced into electricity markets. A patchwork of different solutions looks likely to emerge – with some consumers taking matters into their own hands.

Canada’s tar sands: unburnable carbon

Canada’s tar sands contain some of the biggest proven oil reserves in the world. They are mainly found in Alberta. But mining these tar sands, to produce ‘synthetic’ crude oil, is expensive. The process also releases more greenhouse gases than conventional oil production does. If we are serious about arresting climate change then these reserves need to stay in the ground.

What are tar sands?

Tar or oil sands are unconventional natural crude oil sources that have a viscous, tar-like consistency. A mixture of sand, clay, water and bitumen, the sands are really a bio-degraded form of crude oil: “Old oil, [it’s] kind of like old wine that’s past its peak.”[i]

The bitumen part must be separated out and then upgraded into a synthetic crude oil (syncrude) before it can be further refined into petroleum products like gasoline and diesel.

Two different production processes can be used to extract the bitumen from tar sands: open-pit mining, used when oil-sands deposits are close to the surface; and in-situ mining, used when oil deposits are deeper underground.

Open-pit mining accounts for around half of all production. The process is destructive. First, forests must be cleared away. Then the tar sands are dug out, using enormous shovels, and they are then transported to processing facilities in trucks several storeys high.

Greenhouse gas emissions

‘Well-to-wheels’ life-cycle methodologies calculate the GHG emissions released in producing a petroleum product and getting it to the petrol pump. They don’t calculate emissions once you start driving. According to IHS CERA an Albertan tar-sands project releases between five and 15 per cent more GHG emissions from ‘well-to-wheels’ than does conventional oil production.

The extra emissions come from two main sources: fuel input and ‘fugitive’ emissions. Fuels used in open mining projects include diesel, electricity and natural gas – for trucking and steam production, and for upgrading the oil to create syncrude. (Syncrude then has to be refined again to obtain the final-use fuel.) Around 20 per cent of all Canadian natural gas produced serves the tar-sands industry.

Fugitive emissions are another problem. They stem from natural gas leakage, venting or flaring during mining. Venting is a process that releases any associated natural gas into the atmosphere; flaring burns off this unwanted by-product – because it’s not profitable to get it to a pipeline. 

Overall, the Canadian oil-sands industry generates emissions equivalent to Portugal’s – as a country. Portugal is ranked 56 out of 142 GHG-emitting countries worldwide.[ii] Open-pit mining also has the added effect of destroying Albertan boreal forest – a net carbon sink. All this makes Canadian tar sands development a significant net contributor to global climate change.

Who is the consumer?

Despite the emissions released during production, final-fuel combustion is ultimately more troubling. Emissions weigh heavily in the consumption phase, contributing 70 to 80 per cent of overall lifecycle emissions.

The US is Canada’s primary export market for syncrude. It is transported by pipeline to specialised refineries mostly in America’s Midwest. Around three-quarters then becomes gasoline and a quarter is turned into diesel, feeding domestic markets.

The controversy surrounding the Canadian-US Keystone XL pipeline project stems from US environmentalists’ opposition to production from the tar sands, since it is a particularly emissions-intensive source of crude oil. Yet, Albertan syncrude can still be imported by train, with or without Keystone XL, and transport by train has historically caused more leaks and accidents

Unburnable carbon

If all known oil reserves worldwide were extracted, produced and then used, climate change would occur on a dramatic, irreversible and dangerous scale. We have a lot of ‘unburnable carbon’. So we need to choose which sources, if any, we are going to develop. ‘Unburnable carbon’ refers to fossil fuels that can’t be burnt if the world it to limit carbon emissions so as not to trigger serious climate change.

Most oil that is easily and commercially producible around the world therefore needs to remain in the ground.

Tar-sands projects are among the world’s most expensive and marginal oil production projects – meaning that the cost of production is significantly higher than for conventional oil. In addition, tar-sands oil is only profitable when international oil prices are close to $100 per barrel. Canadian producers are already taking a hit. The International Energy Agency has estimated that a new Canadian oil sands project will cost up to 10 times that of a conventional project in the Middle East.

The economic cost

Research by the Canadian government and the Pembina Institute shows that Canada’s manufacturing slowdown is partly the result of the Canadian dollar appreciating. This has risen over the past decade as exports, mostly of crude oil, have risen. Essentially, the development of Alberta’s oil sands is hampering the manufacturing growth.

Continued reliance on commodity exports will divert investment away from the transition to a low-carbon economy. Being endowed with diverse natural resources, and having advanced manufacturing, service and innovation sectors, Canada has alternatives. Progress within more innovative and value-additive sectors is being overlooked, locking Canada into a high carbon-intensity development path.

The impact of tar-sands development on global climate change, though alarming, is not the only reason to discourage such development. They are not only of questionable benefit to the Canadian economy overall but are unlikely to remain profitable in a low oil-price climate.

Finally, as a significant GHG emitter, if Canadian politicians were to take a lead on climate change issues they could have a real political impact worldwide. Perhaps, the Canadian government and people could leave these particular hydrocarbons in the ground.


[i] The U.S Oil and Gas Boom, Ifri 2012

[ii] S. Dyer, M. Dow, J. Grant, M. Huot & N. Lemphers, Beneath the Surface : a review of the key facts in the oil sands debate, The Pembina Institute, 2013

Note: where unquoted statistics can be credited to the Pembina Institute.

What the frack?

The US shale revolution is a hot topic these days. It’s one reason  America recovered faster than Europe following the 2008 global financial crisis. But what is shale gas and shale oil? And what’s all the controversy about?

Fracking 101

Hydraulic fracturing, abbreviated to “fracking,” technology is not new. It’s been around since at least the 1920s. It simply got cheaper and easier to do in the last ten years. Basically, instead of drilling multiple wells to extract gas or oil from underground rock formations, water or a mix of chemical lubricants is injected into the ground at very high pressure to shatter or “frack” the surrounding rock and increase yield from the well. This can be done several times at different intervals along the well shaft. The gas then travels up the well shaft and is collected at the surface.

Fracking can also be carried out horizontally as sketched in the diagram below. Rather than drilling several vertical wells down into the same shale rock layer, the well turns a corner and follows the hydrocarbon producing rock.

fracking-diagram

Shale gas is the same organic compound we refer to when we say natural gas – primarily methane. Shale actually refers to the porous rock within which gas is trapped. Generally shale, but sometimes sandstone. It’s like a solid sponge which shatters under the high-pressure injections of water and releases gas.

The most profitable shale “plays” (industry-speak for a geological area containing underground shale gas reserves) are described as “wet” because they also contain crude oil. This liquid hydrocarbon is called shale oil or light, tight oil being trapped in the porous rock and very high quality crude.  [i]

The shale gas revolution

Small and medium-sized producers began fracking in the United States several years ago. Enormous shale plays were discovered in Pennsylvania (Marcellus), Texas (Eagle Ford), and North Dakota, Montana (Bakken). All very profitable whilst international oil prices were high. Since the US gas pipeline network is so well developed it was easy to market the associated natural gas.

The gas market was flooded with diverse new supplies – decreasing gas prices at physical trading hubs substantially. This was a huge boon for industry. Cheaper energy has made US exporters more competitive whilst Europe continues to struggle with higher gas prices and economic recession.

It was heralded as a golden age of gas. This was good news for US greenhouse gas emissions too. Emissions have decreased since gas became more competitive with cheap, but polluting coal in the electricity sector. Additionally, some fuel-switching has occurred with natural gas replacing petrol in a limited number of cases in the transportation sector. This is no small achievement. The US transportation sector is overwhelmingly the greatest source of greenhouse gas emissions in the world.

Could the shale gas revolution happen in Europe?

Two factors allowed US production to take off the way it did. Firstly, in the United States mineral wealth is privately owned. Meaning whatever you dig up and find in the subsoil beneath your property belongs to you. This is why we have the stereotype of a Texan oil baron. A lucky farmer that strikes oil on his ranch keeps one hundred percent of the profits. (Best practice is to hide your find from your neighbours for as long as possible, lest they get digging as well).

In Europe governments retain mineral and mining rights. There is much less incentive for small-time producers to drill for hydrocarbons outside of the United States. Despite your capital investment, the profitability of the project is unpredictable.

Second, the industry was almost completely unregulated when it got started. The wells were already pumping gas and turning a profit before proper regulatory oversight came into play.

Fracking companies have been targeted with accusations of poisoning aquifers. Aquifers are a subsoil layer that must be drilled through to reach shale rock formations below. This is also referred to as groundwater – frequently a natural source of water for rural and urban communities.

There have been cases of the chemicals used during fracking processes leaking into the groundwater in parts of America. Very toxic lubricants were used to make the wells more productive in the early days. Nowadays shale gas producers are willingly reporting the chemicals they are using, (previously considered a commercial secret,) to try and regain the American public’s confidence. And a properly reinforced well should not be leaking into an aquifer for any reason. It’s eventually been made harder for frackers to get the right permits to go ahead with new projects.

Proper geological imaging to ensure wells are drilled far from sensitive fault lines, as small earth tremors have been linked to fracking processes, and regulations regarding water use in drought-prone areas have emerged too.

There are shale basins in Europe, notably in France, Poland and the UK, quite close to dense population centres. If proper regulation oversees the production process chemical leakage and earth tremors are totally avoidable. Nevertheless, the conditions that shaped a shale gas revolution in America are still unlikely materialise in Europe.


[i] This should not be confused with oil shale, which is kerogen. Kerogen rock needs to be heated up to extract crude oil. This is a very different and more expensive industrial process.

Oil prices not too low for Saudi Arabia

My last post explained why international oil prices have fallen dramatically during the last six months. This has harmed the profitability of many oil producers.

International oil traders and producing companies have called on the Organisation of Petroleum Exporting Countries (OPEC) to react to the fall in oil prices. Saudi Arabia is the biggest producing country within OPEC and often represents the group. But what can the Saudis do?

For a long time Saudi Arabia was the world’s largest oil producer. The shale oil revolution changed this. Last year, we saw the US overtake both Saudi Arabia and Russia – the other big player – to become the world’s largest oil producer. Nevertheless, the US consumes a lot of what it produces. Saudi Arabia is still the world’s biggest exporter. Moreover, its vast reserves and production capacity allow it to “swing” supplies. That is, quickly alter the volume of oil it puts into the international market. In a nutshell, decreasing copious OPEC supplies would alleviate the international supply-glut and boost the international oil price.

To do this OPEC must accept a decrease in total sales volumes and a smaller market share. The burden of cutting back volumes falls predominantly on Saudi Arabia as OPEC’s biggest producer. Saudi Arabia has had experience in the past with cutting supplies whilst other OPEC members “free ride.” Meaning they benefit from an increase in prices without decreasing their sales volumes as agreed.[1]

International producers are effectively asking Saudi Arabia to do them the same favour. Just why would it do so in a competitive market?

For the moment Saudi Arabia has indeed refused to offer anyone any favours. What’s more getting oil out of the ground is very cheap in Saudi Arabia. Its oil wells have some of the lowest “lifting” or production costs in the world. This is what the graph below shows us:

BEP - IEA graph

The ultra-polluting Canadian tar sands projects are well out-of-the-money at oil prices of $50/barrel, since it costs $85 to produce a barrel of oil.[2]

The graph also shows us that Saudi Arabia can remain profitable close to $20/barrel. It could let current prices keep falling without sacrificing market share. Today’s oil price is less of a problem for Saudi Arabia than other countries where lifting costs are higher.

Yet, it is unlikely Saudi Arabia will let prices fall that far. Profits from oil sales directly support the Saudi government’s budget. Also, higher prices eventually become more important than sales volumes as profit margins tighten. For example, if I sell ten barrels at $100 each this is the same as selling a hundred at $10 each. Except that if it cost me $9 to produce each barrel my total profit is $910 in the first scenario and only $100 in the second scenario.

For now Saudi Arabia appears content to keep the price low and wait for US shale oil producers with thinning profit margins to leave the market. This strategy will cause the US shale oil revolution to lose pace and protect Saudi Arabia’s market share in the long term. However, we might see OPEC revise their policy later in 2015.


[1] It’s hard to measure exact output and countries report their own production volumes.

[2] I’ll write about the economic feasibility of the tar sands projects soon.

Why is oil suddenly so cheap?

Between 1998 and 2008 the price of oil increased ten-fold. Everyone was talking about peak oil – the idea that production would plateau and demand for oil would outstrip supply. Skyrocketing prices would force us to replace what we put in our cars. In 2008 prices broke the $100/barrel ceiling – and then kept climbing.

What does it mean to say oil is $100 per barrel? When we talk about dollars we mean American dollars. Barrels are just a standard measure of volume (159 litres). The price of oil refers to a benchmark – a reference price. In the United States this is West Texas Intermediate (WTI), which is a blend of crude oils from diverse suppliers, which mingle at a physical hub in Cushing, Oklahoma. In Europe the benchmark is called Brent – a blend of North Sea produced crude oils. For a crude to become a benchmark there must be enough suppliers and enough barrels that the supply, and therefore the price, cannot be controlled by one player.

Crude oil needs to be processed and refined to produce the more valuable products, such as gasoline or jet fuel, that industry and consumers can actually use. So it is refineries that buy crude oil from producers. However refiners don’t all buy WTI. There are many different varieties of crude oil. An oil producer will mark up or mark down their crude oil relative to a reference price. This is why we call WTI and Brent benchmarks.

What determines this mark up or mark down? The quality of your oil. Oil can be light or heavy – a lighter, less viscous crude produces more of the more valuable petroleum products such as gasoline during the refining process. Oils are also classified as sweet or sour, which refers to the sulphur content. Sulphur is a pollutant which must be removed during refining. This is expensive to do. So the more sour your oil the more pricey the sulphur-removal process.

Oil producers are in the game to turn a profit.The WTI price affects your profitability as a producer.  For example, let’s say WTI is $100/barrel. If it costs you $70/barrel to extract crude oil from a well and you are selling it at a $20 discount to WTI then your profit per barrel is $10/barrel. (That’s a huge win.)

However, if the international price of oil – the WTI benchmark – falls $10 then you lose your profit margin.

A few years after WTI hit $100/barrel (and then went higher) it suddenly fell to $50. Multiply that by the millions of barrels being bought and sold and you can imagine there were some pretty big winners and losers. That’s the situation we have today. But why?

In less than one hundred and fifty words:

1. Since 2008 Europe underwent a recession which dampened demand for oil as economic growth dwindled and consumer spending dropped.

2. The United States is the world’s biggest oil consumer and used to drive global demand. However, over the past few years an energy revolution no one predicted took place in the US. As shale gas “frackers” began producing natural gas and pumping it into the regional pipeline networks, associated shale oil was also being produced. The best fields are called “wet” since they produce oil as well as gas, oil being more valuable. So within a few years the US went from being a huge importer to near self-sufficiency in crude oil production.

3. This meant that global oil markets were dramatically over-supplied. The supply glut happened because two of the biggest markets – Europe and the US – simply weren’t as hungry for crude oil anymore.

These days we actually talk about peak demand for oil. Technology and extraction processes get better every year, so it’s likely we will be able to produce oil for many years to come. However, production will become more expensive and, as environmental pressures weigh in, oil will become pricey enough that consumers and governments look for replacements. Even if that means buying an electric car or investing heavily in public transport.

Peak demand didn’t happen when prices skyrocketed in 2008. It might yet. Or it’s possible that demand for oil is dropping away. The international price will wane if other energy sources or energy efficiency measures become more competitive and attractive. We will have to wait and see if oil demand recovers in Europe or if Asia’s growth fills the gap.